Lesson 13: Visual Symbols
Visual Symbols
- are
representations of direct reality,
which comes in the form of signs and
symbols.
Drawings
- a drawing may not be real thing but better to have a
concrete visual aid than nothing. To avoid confusion, it is good that our
drawing correctly represents the real thing.
Cartoons
- another useful visual symbol that can bring novelty to
our teaching is the cartoon. A first-rate cartoon tells its story
metaphorically.
Poster
- is any piece of printed paper designed to be attached to a wall or vertical surface. Posters are used for reproductions of artwork, particularly famous works, and are generally low-cost compared to original artwork
Strip Drawings
- a sequence of drawings in a newspaper, magazine, etc.,
relating a humorous story or an adventure.
Diagrams
- “It is any line drawing that shows arrangement and
relations as of parts to the whole, relative values, origins and development,
chronological fluctuations, distributions, etc.” (Dale 1969)
Types of Diagrams
- Affinity
Diagram – used to
cluster complex apparently unrelated data into natural and meaningful groups.
- Tree
Diagram – used in
increasing details or various tasks that must be accomplished to complete a
project.
- Fishbone
Diagram – cause-and-effect
diagram.
Charts
- It is a diagrammatic representation of relationships
among individuals within an organizations.
Types of Charts
- Time
Chart - tabular
time chart that presents data in ordinal sequence.
- Tree
or Stream Chart – depicts
development, growth and change by beginning with a simple course with spread outs
into many branches.
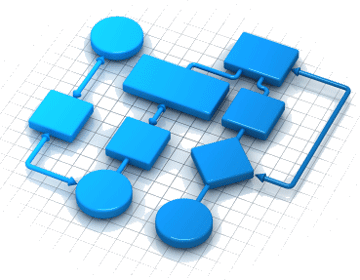
- Flow
Chart – visual way
of showing a process from beginning to end.
- Organizational
Chart – shows how
one part of the organization relates to other parts of the organization.
- Comparison
and Contrast Chart –
shows similarities and differences.
- Pareto
Chart – type of bar
chart, prioritized in descending order of magnitude or importance from left to
right.
- Gantt
Chart – is an
activity time chart.
Graphs
- Pictures that help us understand data.
Types of Graphs
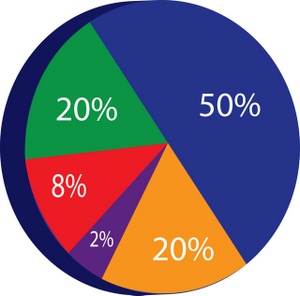
- Circle
Graph – recommended
for showing parts of whole.
- Bar
Graph – use in
comparing the magnitude of similar items at different ties or seeing relative
sizes of the parts of a whole.
- Pictorial
Graph – make use of
picture symbols.
- Graphic
Organizers – you
met several graphic organizers in your subject, principles of teaching.
Maps
- Is a representation of the surface of the earth or some
part of it.
Types of Maps
- Physical
Map – altitude,
temperature, rainfall, precipitation, vegetation and soil.
- Relief
Map – three
dimensional represents and show contours of the physical data of the earth or part of the earth.
- Political
Map – gives
detailed information about country, provinces, lakes, rivers etc.


No comments:
Post a Comment